The price of XRP has nosedived substantially to a level that it last touched almost 70 weeks ago. At the current time, XRP’s price have been trading near its immediate support level of $0.36.
Bitcoin continues to be on shaky grounds as the coin tried recovering by moving past the $30,000 mark. At press time, the coin fell back to $29,700.
The majority of the industry’s altcoins have continued to extend losses today. The bearish pull remains strong in the market at the time of writing.
Over the last 24 hours, the market has bottomed out and that is why a chance of price revival can still be considered.
The technical outlook of the coin shows that a relief rally could be on the charts, however, the macro market is still fragile.
Strength from the broader market would be needed as well so that sellers don’t outnumber buyers in the market forcing prices to fall again.
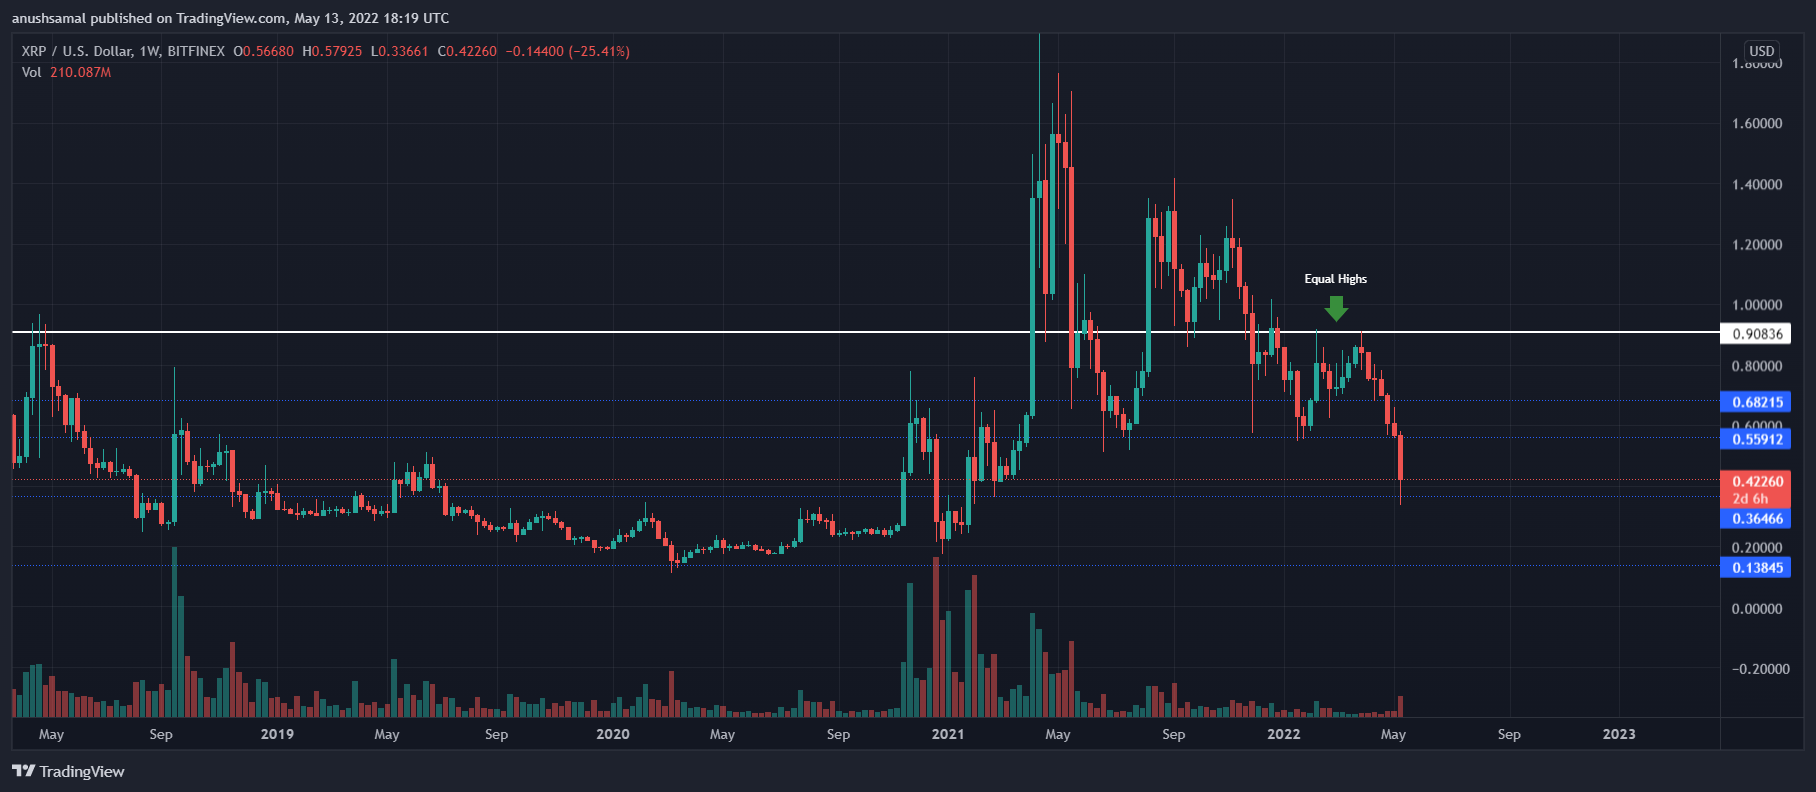
XRP was trading at $0.42 at the time of writing. The coin had presented signs of revival because the coin soared by 10% over the last 24 hours. It is still quite uncertain if XRP will manage to trade above its nearest support line of $0.36.
A break below which can cause the coin to tumble to a low of $0.13. With buyers returning, XRP might attempt to trade above its immediate resistance of $0.56.
XRP also flashed an equal high on the one week chart, this pattern is connected to bullish price action in the market. Toppling over the immediate resistance can push XRP to $0.68, staying above which can help invalidate the bearish thesis in the market.
The volume of XRP traded had increased and the bar was red which depicted bearishness.
Technical Analysis
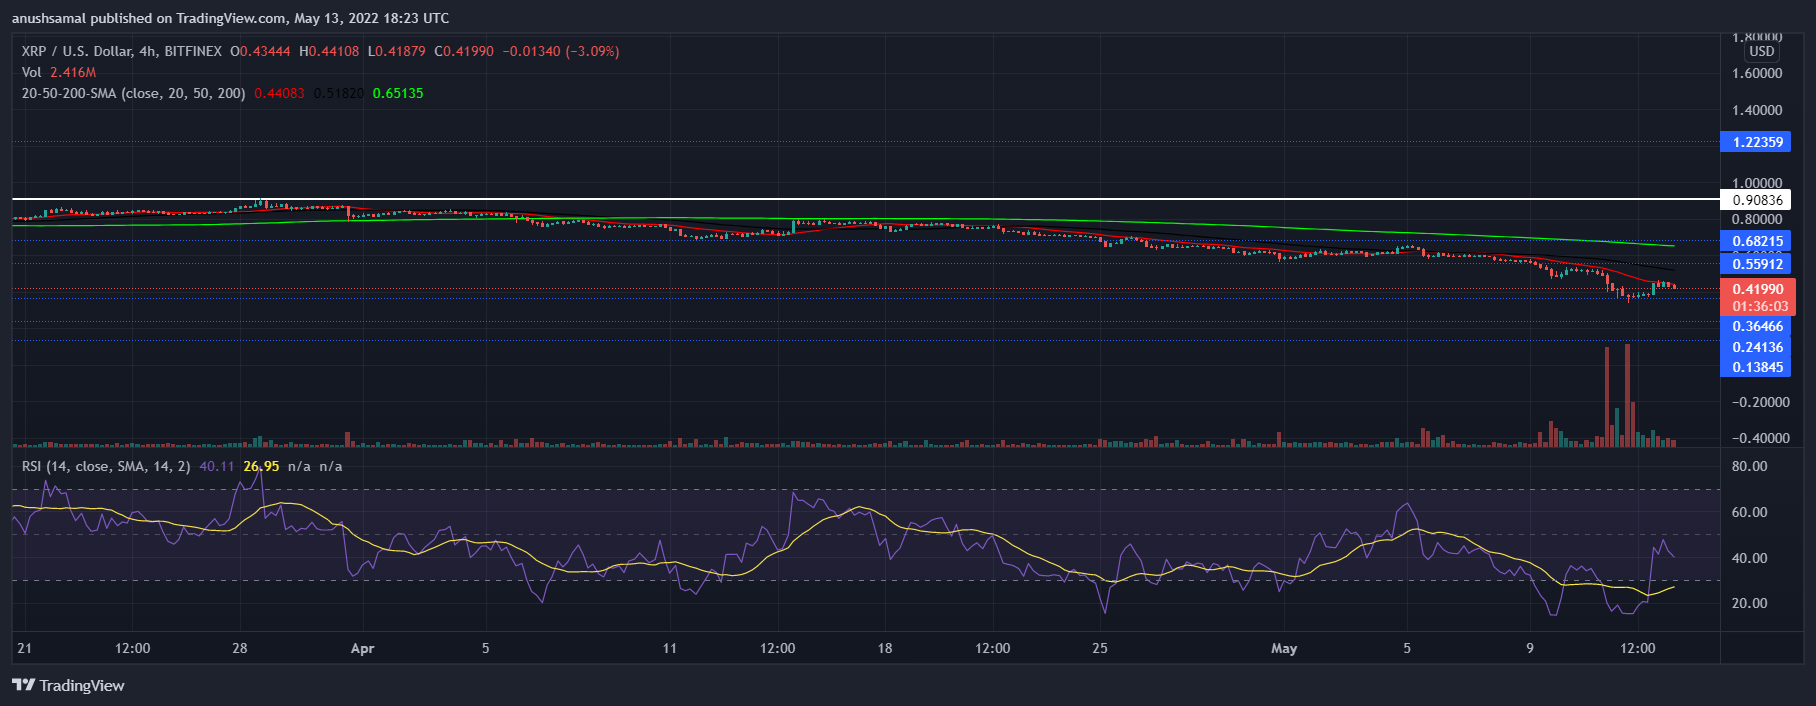
XRP had attempted to make a price revival but continued selling pressure have tired the bulls out. The same is reflected on the 20-SMA indicator.
The price of XRP was seen below the 20-SMA line. This reading signified sellers were driving the price momentum on the market.
On the Relative Strength Index, after facing an intense sell-off across the market, buyers re-entered. XRP was no longer seen in the oversold zone on the RSI.
After the recovery though, XRP again fell prey to the bears and RSI flashed a downtick signifying increased selling pressure.
With the price revival, XRP’s technicals have displayed an onset of positive price action. It is however too early to say if it is a beginning of a shift in the price action.
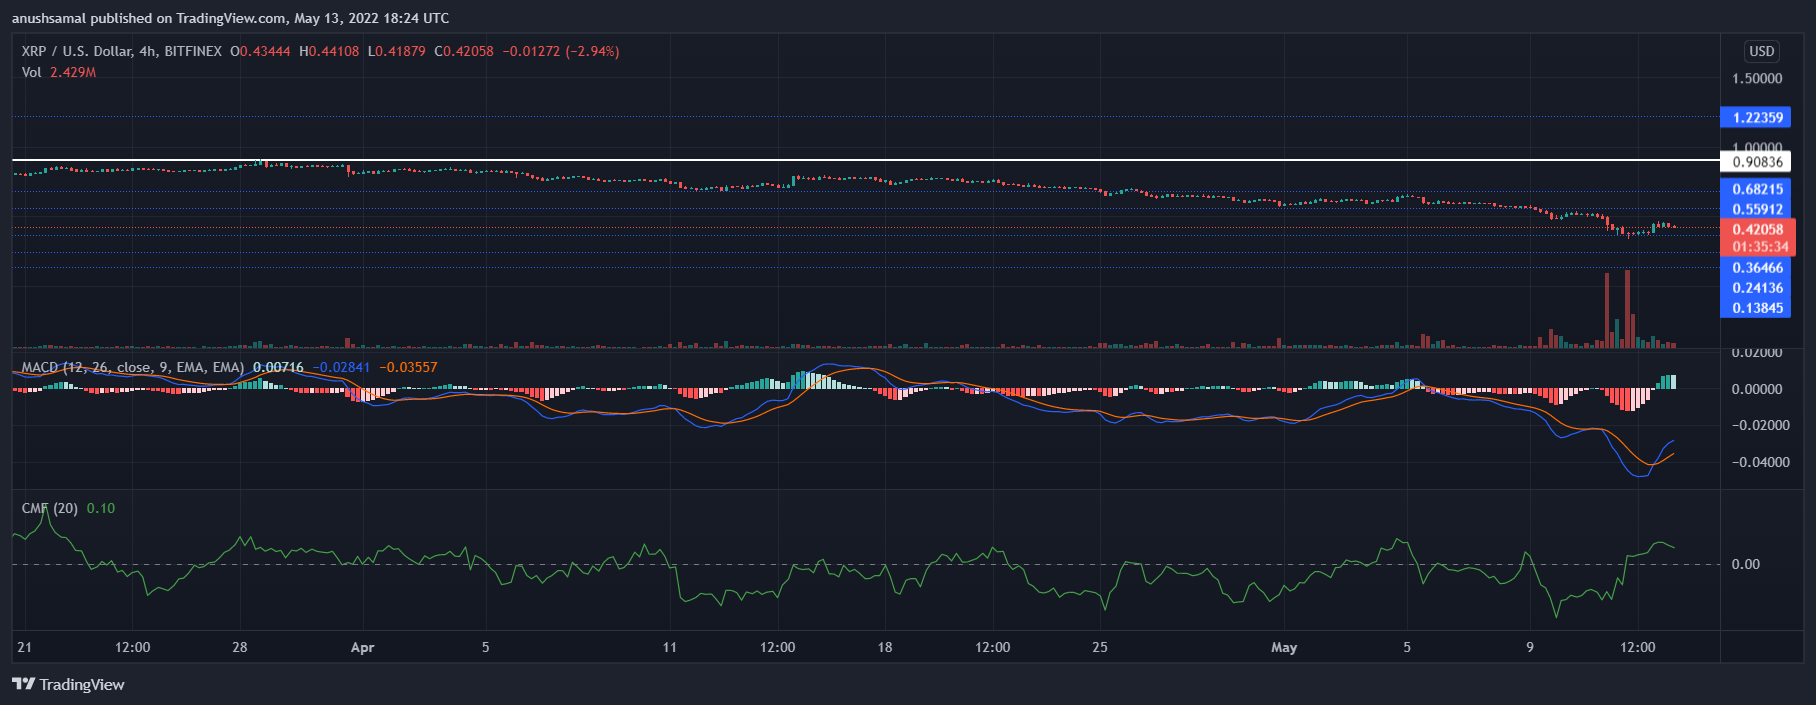
Moving Average Convergence Divergence underwent a bullish crossover on the four-hour chart. The indicator flashed growing green histograms above the half line and that means bullish momentum for the coin.
XRP also could witness a northward push in prices because the Chaikin Money Flow was seen above the zero-line. This indicator displays the number of capital outflows and inflows and according to the above chart, capital inflows exceeded outflows at the time of writing.