
Bitcoin started a fresh decline below the $22,000 support against the US Dollar. BTC is declining and might extend losses below the $20,500 support zone.
- Bitcoin started a fresh decline and traded below the $22,000 level.
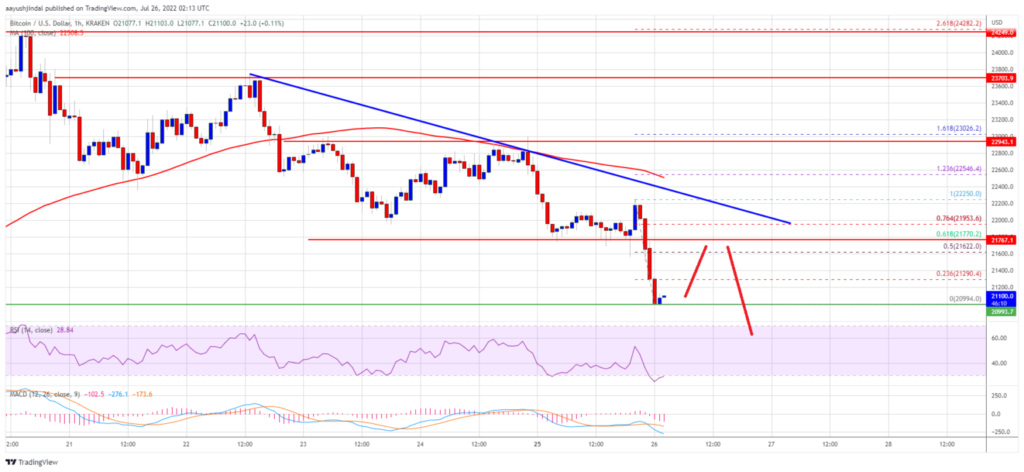
- The price is now trading below the $22,000 level and the 100 hourly simple moving average.
- There is a major bearish trend line forming with resistance near $21,950 on the hourly chart of the BTC/USD pair (data feed from Kraken).
- The pair might decline further if there is a clear move below the $20,800 level.
Bitcoin Price Gains Bearish Momentum
Bitcoin price started a fresh decline after it failed to clear the $24,000 resistance zone. There was a steady decline below the $23,500 and $23,000 levels.
The bears gained strength for a move below the $22,500 support level and the 100 hourly simple moving average. Finally, the price traded below the $21,500 support level and even spiked below $21,000. A low is formed near $20,994 and the price is now consolidating losses.
On the upside, bitcoin price could face resistance near the $21,650 level. It is near the 50% Fib retracement level of the recent decline from the $22,250 swing high to $20,994 low.
The next key resistance is near the $22,000 zone. There is also a major bearish trend line forming with resistance near $21,950 on the hourly chart of the BTC/USD pair. The trend line is near the 76.4% Fib retracement level of the recent decline from the $22,250 swing high to $20,994 low.
A close above the $22,000 resistance zone could set the pace for more gains. In the stated case, the price may perhaps rise towards the $22,500 level. The next major resistance sits near the $23,000 level.
More Losses in BTC?
If bitcoin fails to start a recovery wave above the $21,650 level, it could continue to move down. An immediate support on the downside is near the $21,000 level.
The next major support now sits near the $20,500 level. A clear break and close below the $20,500 support zone might send the price towards $20,000 in the near term.
Technical indicators:
Hourly MACD – The MACD is now gaining pace in the bearish zone.
Hourly RSI (Relative Strength Index) – The RSI for BTC/USD is well below the 50 level.
Major Support Levels – $21,000, followed by $20,500.
Major Resistance Levels – $21,650, $22,000 and $22,500.