
The Sandbox (SAND) Price Prediction – July 6
Reading through the current trading operations in the SAND/USD pairing instruments shows the crypto economy increases in featuring lower highs length a bit higher than the previous sessions. The last 52 weeks of trading have recorded a high of $8.44 and a low of $0.3087.
The Sandbox Price Statistics:
SAND price now – $1.24
SAND market cap – $1.6 billion
SAND circulating supply – 1.3 billion
SAND total supply – 3 billion
Coinmarketcap ranking – #34
The Sandbox (SAND) Market
Key Levels:
Resistance levels: $1.50, $2, $2.50
Support levels: $1, $0.75, $0.50
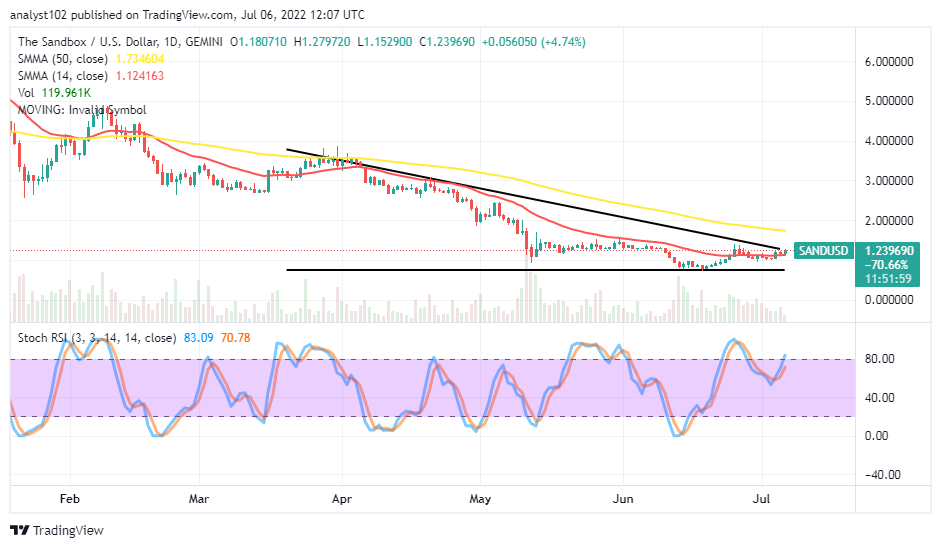
SAND/USD – Daily Chart
The SAND/USD daily chart reveals the Sandbox market operation increases in featuring lower highs in a sequential-moving order against the US Dollar. There has been a lighter-bullish candlestick in the making to establish a buying force is in place to some relative extent. The 14-day SMA indicator is underneath the 50-day SMA indicator. The Stochastic Oscillators have initially slantingly positioned southbound against variant ranges from the overbought region. And they are now trying to cross the lines from around 60 ranges into the overbought area.
Where is the baseline for the current upswing in the SAND/USD market operations?
As the SAND/USD market operation increases in featuring lower highs, the horizontal drew at the $0.755 or thereabout to show the baseline where the current upswing might have found its root cause. A sustainable breaching to the upside past the 14-day SMA trend line will allow the price to test a resistance point around $1.7346, as indicated by the 50-day SMA in the long-term run.
On the downside of the technical analysis, at this point, bears may have to wait for a clear sell signal as the current slow-and-steady motions to the north appear to get exhausted before considering launching a sell order afterward. The positioning of the Stochastic Oscillators, as of writing, suggests the selling orders may be gaining stances close over the buying signal side of the 14da SMA trend line.
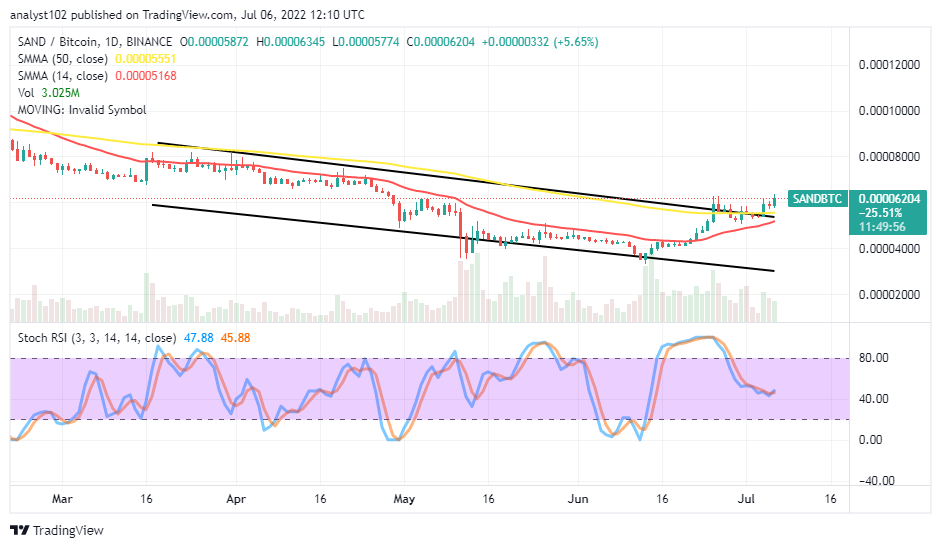
SAND/BTC Price Analysis
In comparison, The Sandbox has been striving to push against the trending outlook of Bitcoin. The cryptocurrency pair price increases in featuring lower highs above the indicators. The bearish trend line drew alongside the 50-day SMA indicator over the trend line of the 14-day SMA. The Stochastic Oscillators are around the 40 range, seemingly trying to cross the lines back northbound. That signifies the counter-trading crypto may still be on the losing note to the base crypto for a while.