Solana over the last 24 hours registered a loss of 7% and fell below the $35.50 price mark. The bears have mauled the cryptocurrency market and overall altcoins have fallen on their charts. Solana also is under the bearish price action despite registering minor gains on the hourly chart.
Despite the gain, bears will try to hinder the price movement as technical outlook painted a negative picture. Bitcoin continues to remain close to the $20,000 mark while other market movers also keep struggling at the time of writing.
The altcoin is dangerously close to the support line of $35. The bulls however have continued to defend the next support line of $30. Buying strength also remains low in the market, with increased selling pressure SOL could again dip and trade near the $30 price level.
The global cryptocurrency market cap today is $941 Billion with a fall of 2.6% in the last 24 hours.
Solana Price Analysis: Four Hour Chart
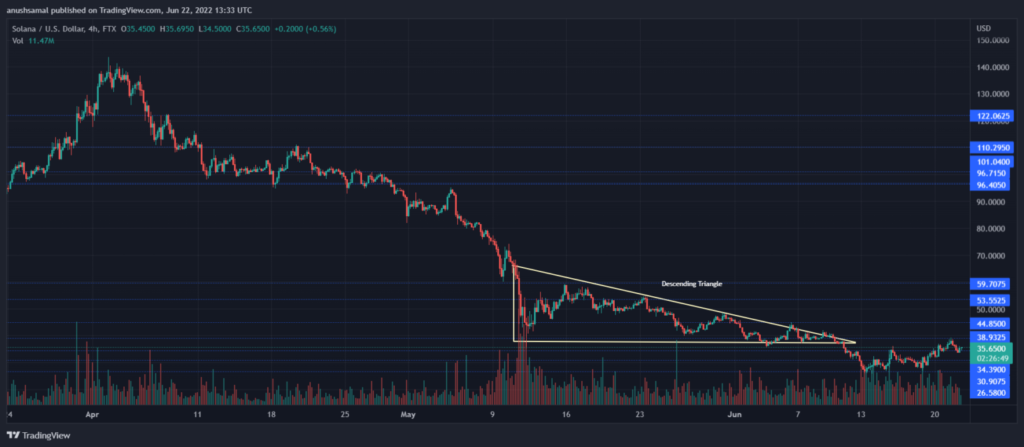
SOL has been optimistic over the past week with double digit gain of 20%. SOL has remained one of the altcoins that have recovered considerably over the week. Despite the recovery, the bulls are tired of pushing the price up.
As the chart flashed a descending triangle which is tied to fall in the price, SOL followed through and declined on the chart. At the time of writing, Solana was trading at $35.65. The coin might witness stiff resistance at the $38 price level.
A fall from the current price level will drag price of SOL to $30 and then to $26. The volume of SOL traded in the last trading session fell signifying that buying strength hasn’t fully picked up.
Technical Analysis
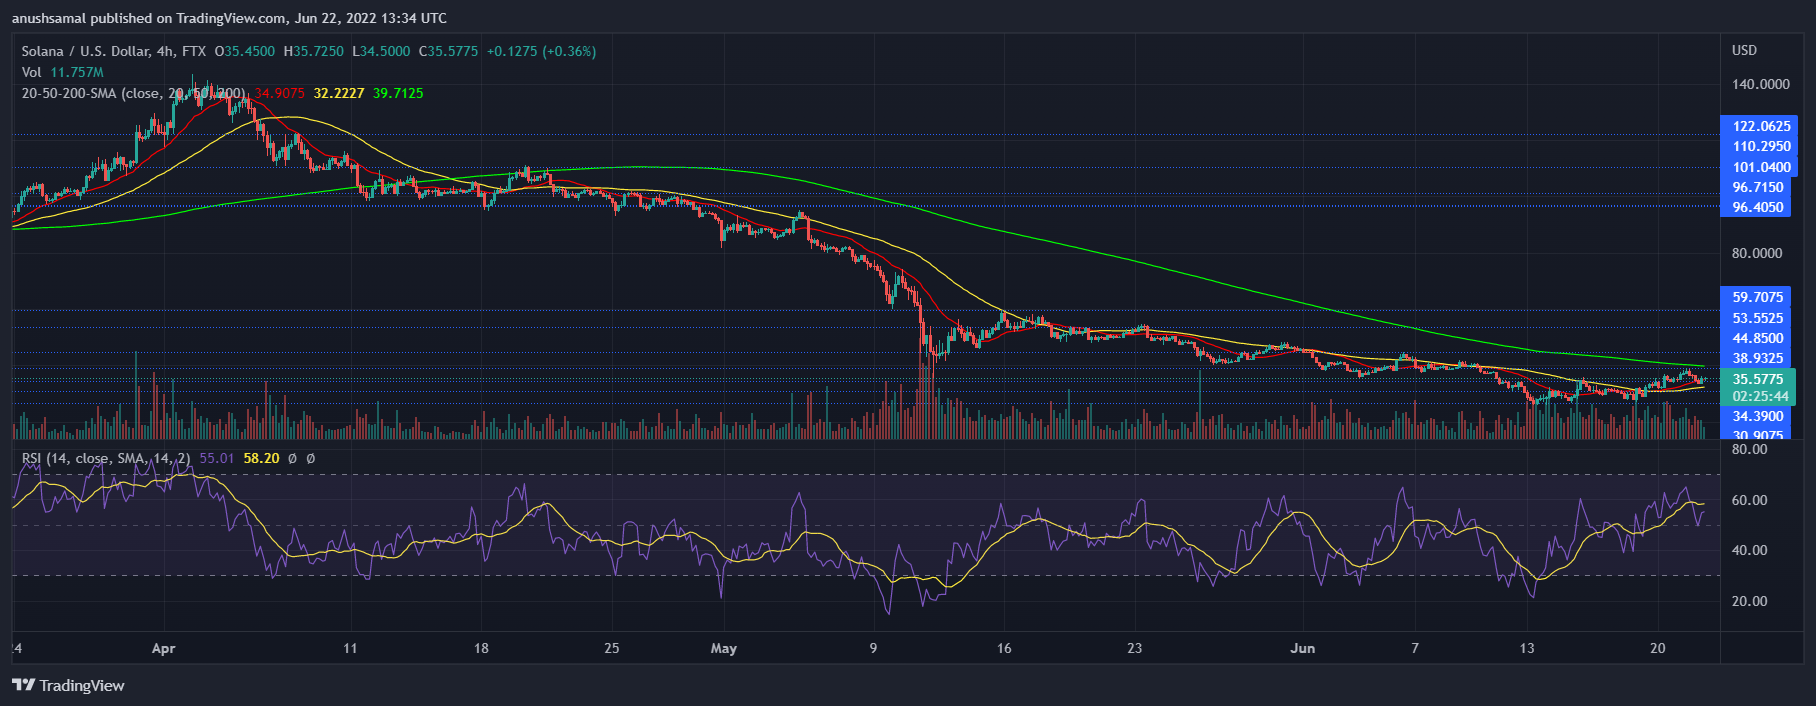
SOL flashed an increase in buying strength but there is a chance that buying strength might dip over the immediate trading session. The Relative Strength Index noted an uptick and was seen above the half-line indicating that buyers outnumbered sellers on the four hour chart.
It is however too soon to conclude if the coin will continue to maintain this price momentum. The coin barely managed to move over the 20-SMA line which indicated that selling strength was still present in the market. At press time however, buyers were driving the price momentum in the market.
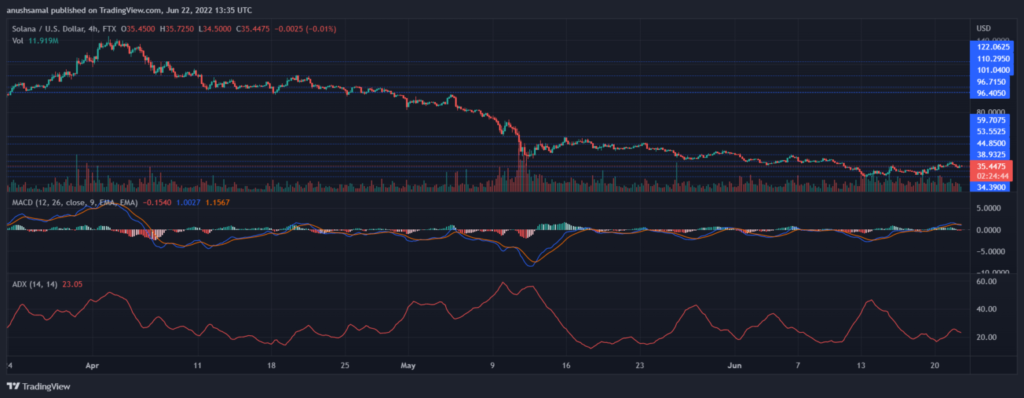
Moving Average Convergence Divergence depict the price momentum and trend reversals. The indicator went through a bearish crossover and formed red histograms. The onset of these histograms were a sell signal for the coin. This can be tied to incoming price decline for SOL.
Average Directional Trend is responsible for registering the strength of the current trend. ADX was moving close to the 20-mark with a downtick, this signals that the trend was losing strength which again pointed towards continued bearishness in the market.