The sellers intensify their pressure in Solana market
Solana Price Analysis – September 19
In case Solana break down $28 support level, price may decrease to the support level at $25 which may extend to $23. When the $23 support level holds, price may increase to the resistance levels at $31, $34 and $38.
SOL/USD Market
Key Levels:
Resistance levels: $31, $34, $38
Support levels: $28, $25, $23
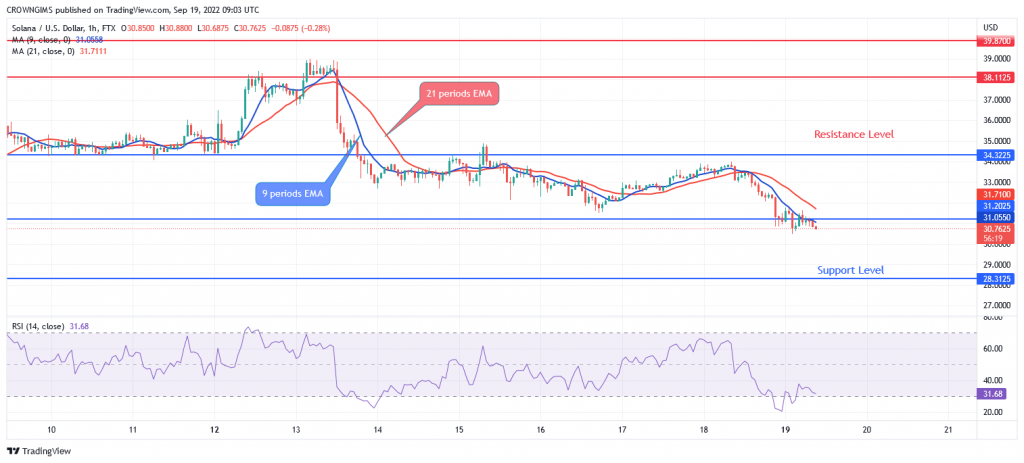
SOL/USD Long-term Trend: Bearish
Solana is on bearish movement on the daily chart. Sellers intensify their pressure and the price could not withstand the pressure. Solana decreases, the former support level of $31 is broken downside and face the support level of $28. The Bearish trend that commenced on 14 August at the resistance level of $38 is still pushing the price towards the support level of $28. Further price decrease envisaged.

Sellers dominate the market as the price crossed the 9 periods EMA and 21 periods EMA downside. In case price break down $28 support level, price may decrease to the support level at $25 which may extend to $23. When the $23 support level holds, price may increase to the resistance levels at $31, $34 and $38. Meanwhile, the relative strength index period 14 is at 46 levels displaying bearish direction.