Serum (SRM) Price Prediction – July 8
A lower line around $0.77 or thereabout has been found by the SRM/USD price as the crypto swings higher from it. The financial book of records shows the market’s all-time high and all-time low values at $13.72 and $0.11. it currently trades around $0.87, approximately at a percentage rate of 12.41 positive.
SRM Price Statistics:
SRM price now – $0.8614
SRM market cap – $227 million
SRM circulating supply – 263.2 million
SRM total supply – 1.1 billion
Coinmarketcap ranking – #120
Serum (SRM) Market
Key Levels:
Resistance levels: $1, $1.25, $1.50
Support levels: $0.50, $0.40, $0.30
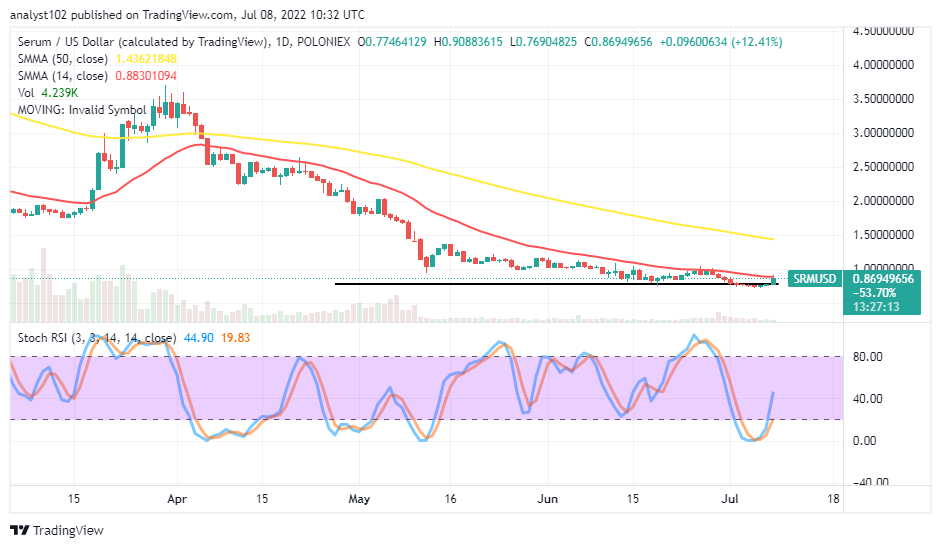
SRM/USD – Daily Chart
The STORJ/USD daily chart reveals the crypto-economic price swings higher from baseline support closely over the $0.50 support level. The 14-day SMA indicator is underneath the 50-day SMA indicator. A bullish candlestick is beefing northward, trying to break past the trend line of the smaller-SMA trading indicator. The Stochastic Oscillators have crossed northbound from the oversold region to touch the 40 range.
Will the SRM/USD market sustain its current upswings to break past some other resistances?
As the SRM/USD market finds support around a baseline of $0.77 or thereabout, indications are suggesting that there will be a possibility of the crypto trade to sustain more ups as it swings higher from the value line. If the end of today’s candlestick finishes bullish past the 14-day SMA trend line, the following days are likely to witness an upward-trending motion in continuation. But, long-position traders should be wary of rejection around the smaller SMA.
On the downside of the technical analysis, the SRM/USD market short-position takers needed to exercise patience at this point for a while. It may not even be too technically sound to re-launch a sell order at a reversal of price action around the trend line of the smaller SMA. The Stochastic Oscillators at a higher range spot or in the overbought trading region will give bears a better time to observe a selling moment in the long run.
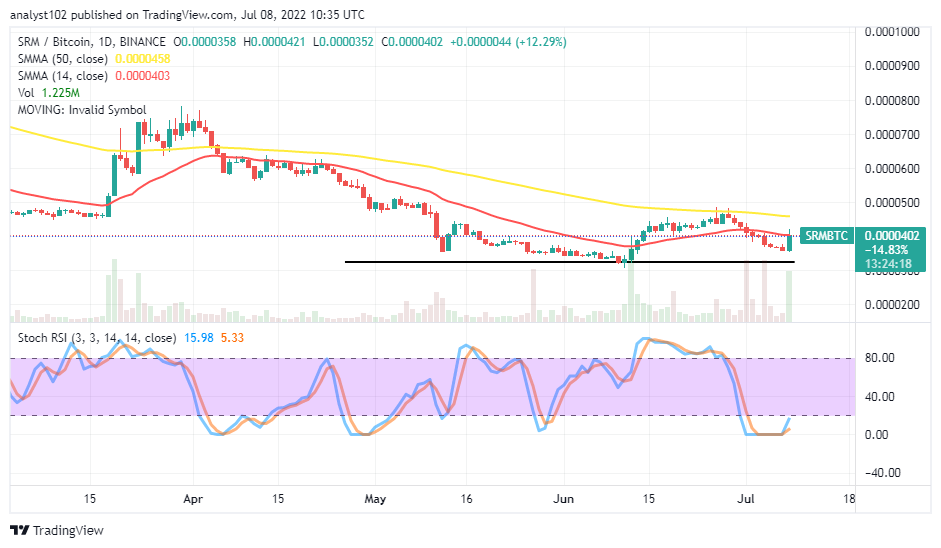
SRM/BTC Price Analysis
Serum has seemingly been finding a stance to build up against the trending catalyst of Bitcoin. The cryptocurrency pair price swings higher closely from a baseline drawn below the SMA trend lines. The 14-day SMA indicator is underneath the 50-day SMA indicator. The Stochastic Oscillators have crossed northbound within the oversold region, pointing to the upside closely beneath the range of 20. With the formation of a bullish candlestick at the time of writing, the base crypto appears to push higher more in the subsequent sessions against its counter-trading crypto.