
XRP Price was constantly consolidating on its four hour chart. The bulls have faded out from the market but are consistently trying to protect price from falling below the immediate support level. Despite the 1.5% appreciation over the last 24 hours, XRP price doesn’t seem to be out of the woods yet.
Over the last one week the coin lost 10% but the coin has maintained its price above the vital support line. Technical outlook for the coin also indicated bearishness. After XRP price lost the $0.39 price level, the altcoin was mostly trading sideways.
For the coin to move upwards it is important that XRP moves above the $0.34 price mark. Buying pressure on the chart declined considerably which was a sign of price weakness.
With Bitcoin moving down on the chart, other altcoins have also dipped on the chart. If XRP price loses the current support level then further downward movement could be expected over the immediate trading sessions.
XRP Price Analysis: Four Hour Chart
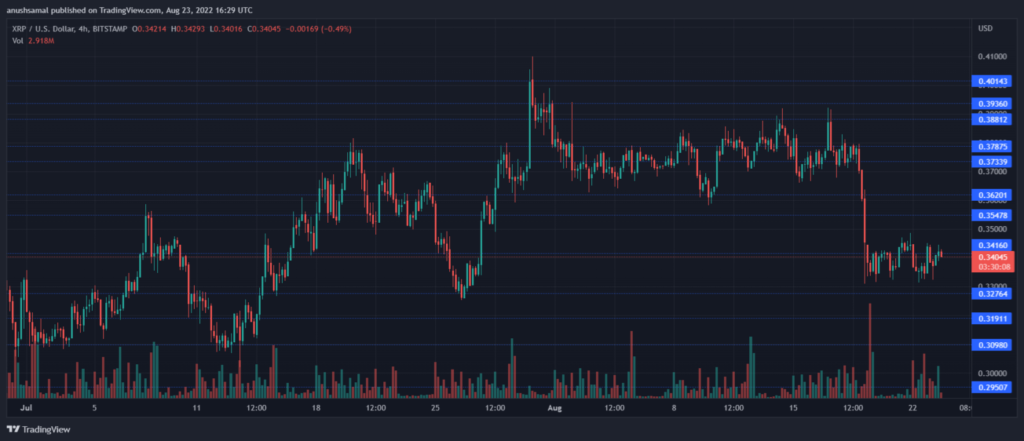
The altcoin was trading for $0.34 at the time of writing. It is crucial for the coin to maintain its price above the immediate support level of $0.33. A fall below that will make the coin trade at $0.29 which would make the coin trade at a multi-week low.
Overhead resistance for the coin stood at $0.37 and if it topples over that price ceiling, the next target was at $0.40.
Ever since the coin lost its long holding support of $0.36, the coin has moved southbound. A move above the $0.34 will help XRP gain back some of its lost value.
The amount of XRP traded in the last session dropped which indicated that the buying strength dropped on its chart.
Technical Analysis
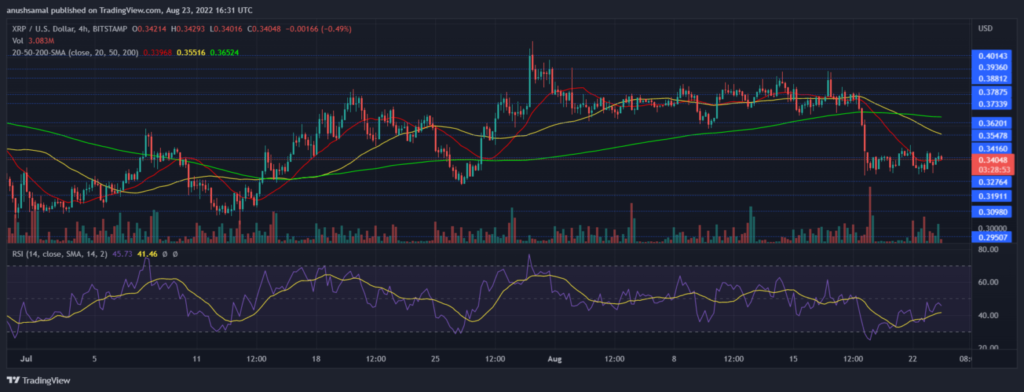
The fall in the price of the altcoin has made sellers re-enter the market. XRP price will need help from the buyers in order to move up the chart. The Relative Strength Index was below the half-line which meant that selling strength was higher than buying strength.
XRP price however, started to peep above the 20-SMA line which is an indication that price could be recovering over the next trading sessions. At this moment however, buyers were starting to drive the price momentum. Sellers although exceeded buyers at the time of writing.
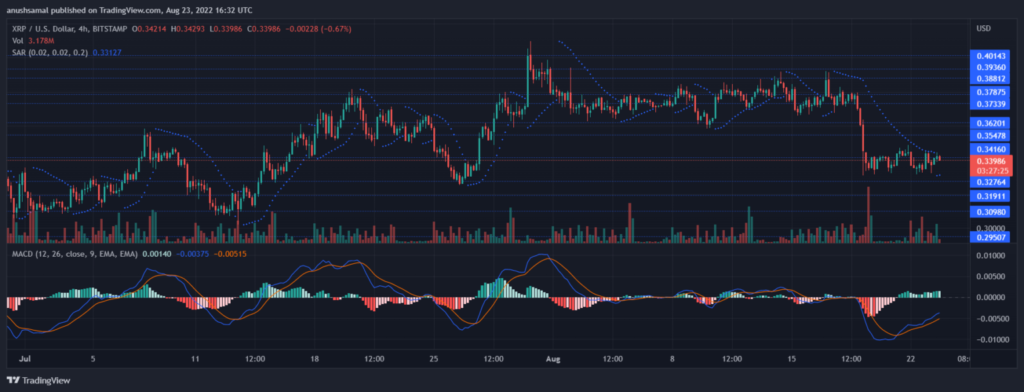
The cryptocurrency although registered fall in buying strength depicted buy signal on its chart. This could mean a change in the price action for the upcoming trading sessions. The Moving Average Convergence Divergence indicates the current price momentum and displayed green histograms which were tied of buy signal for the coin.
If buyers act on the price, there are chances that XRP price might log in gains proving that the bears could exit the market. The Parabolic SAR also determines the price direction of altcoin. The indicator formed dotted lines below the price which is a sign of change in the current price direction. This meant that XRP price could witness some despite over immediate trading sessions.