
Polkadot Price Prediction – July 29
The Polkadot market operation is ranging northward against the American US Dollar. In the last thirty days, the price has been trading between a low and a high point of $6.09 and $8.31. Currently, the market percentage rate is at 4.20 positive.
Polkasot (DOT) Statistics:
DOT price now – $8.20
DOT market cap – $8.1 billion
DOT circulating supply – 987.6 million
DOT total supply – 1.1 billion
Coinmarketcap ranking – #11
DOT/USD Market
Key Levels:
Resistance levels: $10, $12, $14
Support levels: $6, $4, $2

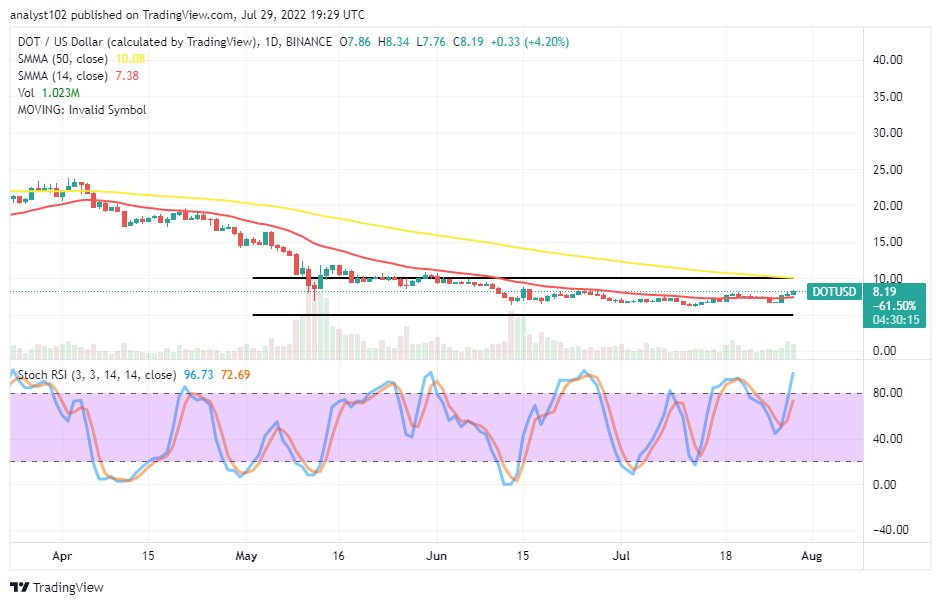
GMT/USD – Daily Chart
The DOT/USD daily chart reveals the crypto-economic market is ranging northward within specified range-bound zones of $5 and $10. Two horizontal lines drew to mark out the points in question. The 14-day SMA indicator is within the range spots underneath the 50-day SMA indicator. The Stochastic Oscillators have made a move into the overbought region.
Will the DOT/USD market experience a correction soon below the $10 resistance level?
A bearish candlestick needs to occur at a higher-trading spot of the $10 resistance level for confirmation of corrections in the DOT/USD trade operation as the market is ranging northward from the trend line of the 14-day SMA. Investors may deem it fit to consider buying into the crypto economy now. Even it has to go down again within the pace of the range-bound spots. The dipper the price, the higher the chance of maximizing profits while the trading cycle changes in favor of bulls moving in the long run afterward.
On the downside of the technical analysis, it is expected that the price has to get reductions by facing a series of rejections around or below the $10 upper range line. A complimentary reading condition between a 1-hour and a 4-hour suggesting a reversion at a higher spot will help determine a decent sell entry. Therefore, traders should be wary of aggressive motion that can move past the range-bound at the top.
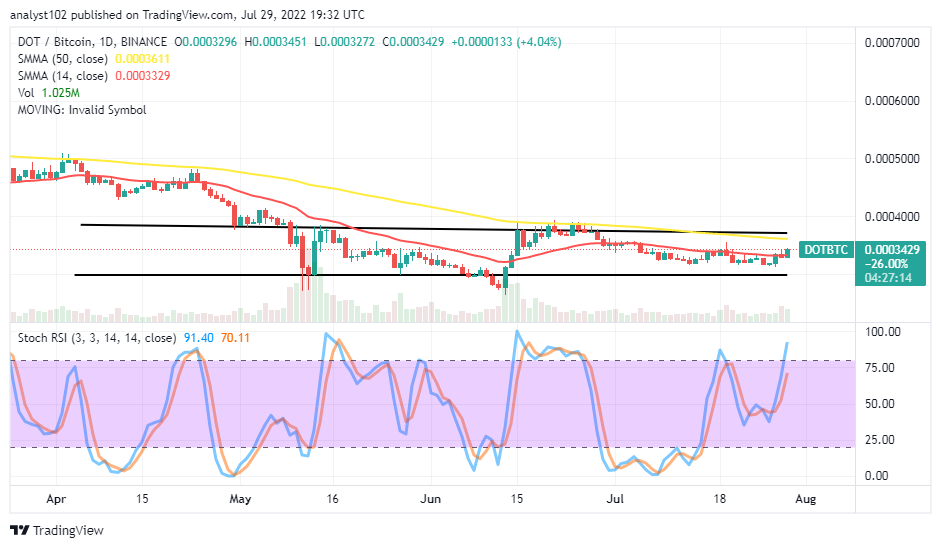
DOT/BTC Price Analysis
Polkadot, in a comparison against the weighing catalyst of Bitcoin, has been pushing around in lower-trading zones. Presently, the cryptocurrency pair price is ranging northward within the range-bound spots. The 14-day SMA indicator is underneath the 50-day SMA indicator. The Stochastic Oscillators have briefly penetrated the overbought region. And a smaller bullish candlestick emerges to indicate the base crypto is somewhat pushing higher against the counter-trading crypto.