Dogecoin has been flashing bullish signs on its short term chart. The coin is currently trading laterally. Over the past week, DOGE registered 7% appreciation. The meme-coin has stabilised on the $0.06 support line. The key support level for the coin stood at $0.064.
For DOGE to continue on a bullish path, demand for the coin has to remain in the positive. On the four hour chart, Dogecoin is targeting the $0.07 level. Although buying strength is still in the positive, there has been a minor decline in the buying pressure on the short term chart.
If buying strength declines, then a pullback is in order for the meme-coin. Bulls will lose steam if the coin does not manage to trade above the $0.064 level for a considerable period of time. With Bitcoin’s price showing signs of upward movement, altcoins are also registering relief on their charts.
The global cryptocurrency market cap today is $997 Billion with a 1.7% positive change in the last 24 hours.
Dogecoin Price Analysis: Four Hour Chart
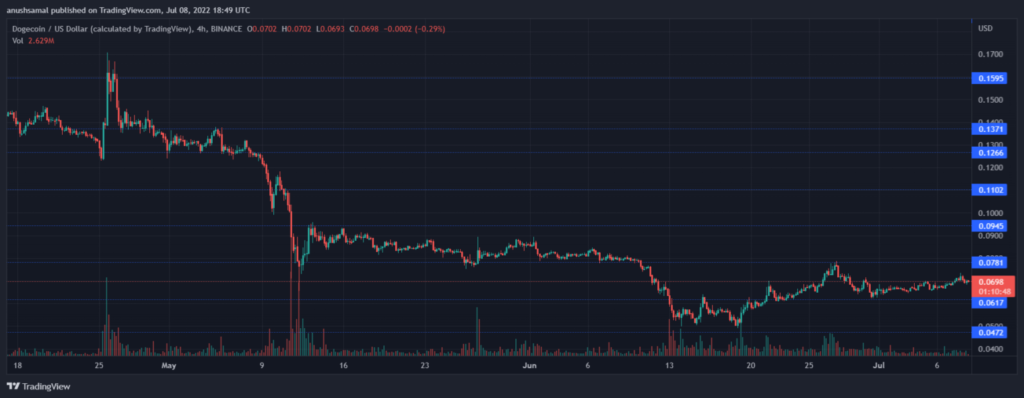
DOGE was trading at $0.069 at press time. The coin has mostly registered sideways trading but has managed to slowly gain over the past weeks. Buyers currently outnumber sellers but if Dogecoin doesn’t move past the $0.070 mark, buying strength might lose momentum.
This may cause DOGE to revisit the $0.047 support level. If Dogecoin moves above the $0.070 resistance mark and trades there for a substantial period of time then a jump to $0.094 might be possible. The amount of DOGE traded in the last session declined considerably signifying a fall in selling pressure which remains a sign of bullishness.
Technical Analysis
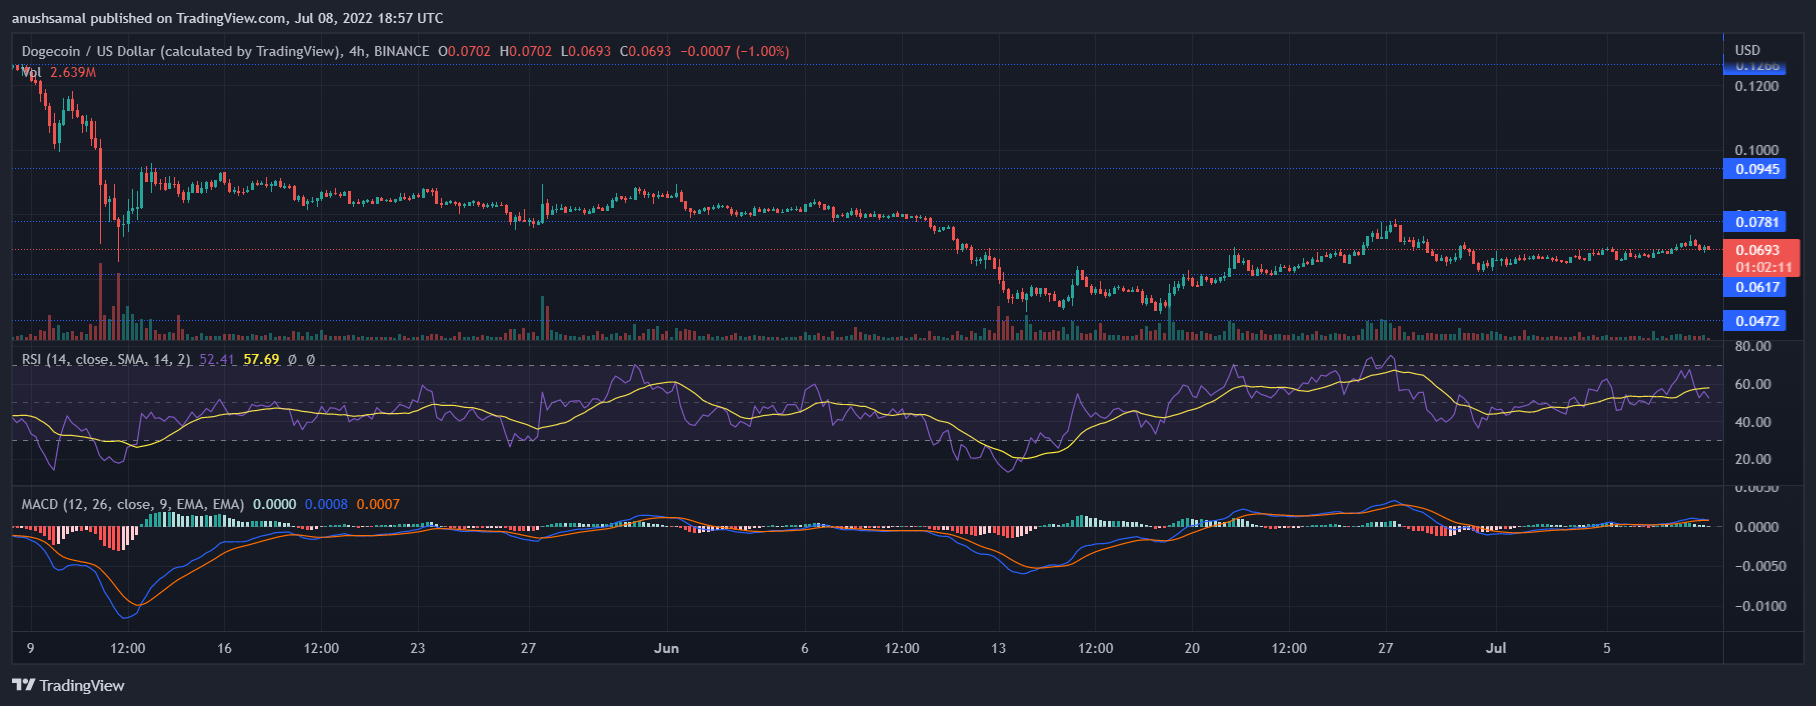
With price of the coin increasing steadily the demand for Dogecoin also moved on an upward trajectory. In accordance with the increased buying strength, the Relative Strength Index was pictured above the half-line.
This reading signified positive buying strength and bullish price action, however, a small downtick on the indicator was noted. Moving Average Convergence Divergence depicts price momentum. MACD underwent a bullish crossover and flashed green signal bars. These green signal bars suggested buy opportunities.
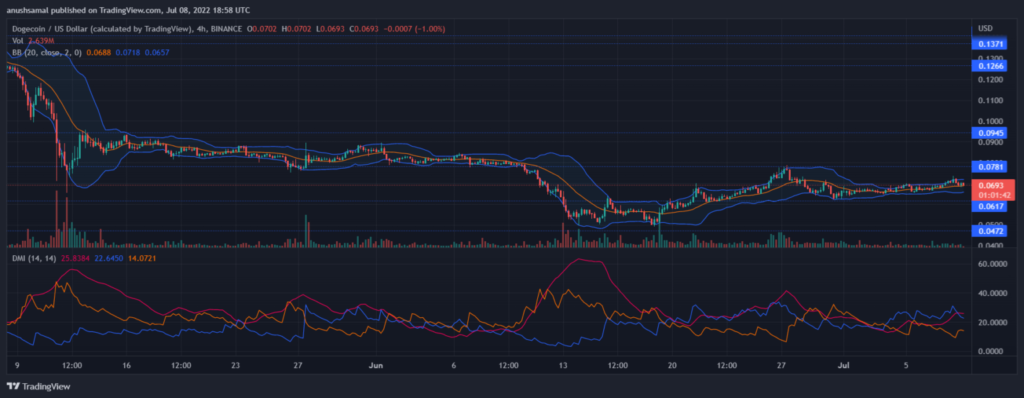
DOGE’s price action is headed in a bullish way but as the coin laterally traded for sometime, it reflected on the indicator seen on the above chart. Bollinger Bands are tied to depicting chances in price fluctuation. Bollinger Bands opened up slightly however, it was mostly parallel suggesting that price of the coin might not undergo heavy movement.
The Directional Movement Index indicates price trend and the strength of the same. DMI was positive as the +DI line (Blue) was above the -DI line (Orange).
Average Directional Index (ADX) rose above the 20-mark, which represented that the current price trend was gaining momentum on the chart.
This indicated that Dogecoin could log short term gains over the upcoming trading sessions.


