Generally speaking, SHIB/USD market is on a downtrend, however, it looks like bears are experiencing some resistance. It is very likely that this is the reason why the downtrend looks mild.
SHIBs Forecast Statistics Data:
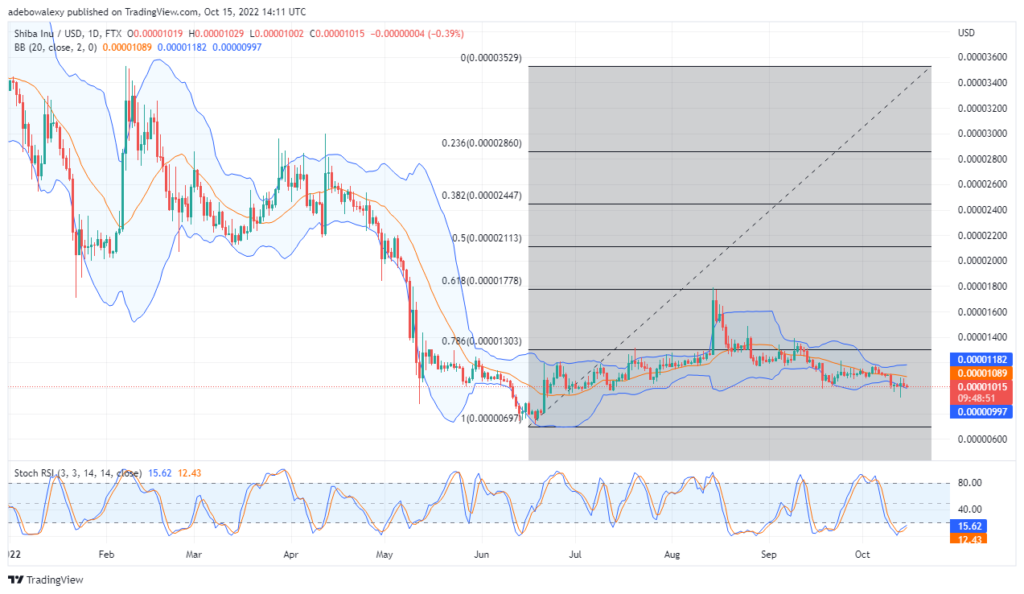
Shiba Inu’s current price: is $0.00001015
SHIB’s market cap: $5.64 billion
Shiba Inu’s circulating supply: 549.06 billion
SHIBs total supply: 589.74 trillion
Shiba Inu’s Coinmarketcap ranking: #15
Key Value Marks:
Top: $0.00001032, $0.00001060, $0.00001075
Base: $0.00001015, $0.00001005 $0.00000990
Shiba Inu Price Prediction Today, October 16, 2022: SHIB/USD Lacks Upside Momentum
Examining the SHIB/USD it could be seen that price action moves slightly downwards. Although the lower limit of the Bollinger indicator has been tested severally, it looks like there are lack of buyers in this market to push the price up, at this point. While it is normal for a bounce to occur off the floor of the Bollinger, due to a lack of buyers there isn’t enough upward push to price action. Furthermore, the Stochastic RSI has delivered a bullish crossover in the oversold, and the lines are now on their way upwards. Nevertheless judging by the level of these lines and the distance between them, we can assume that the trend is still weak buy may gain more strength. Should this form continues, price action may eventually slide to $0.00001000 shortly. However, traders catch any resulting uptrend by placing a buy order at $0.00001027.
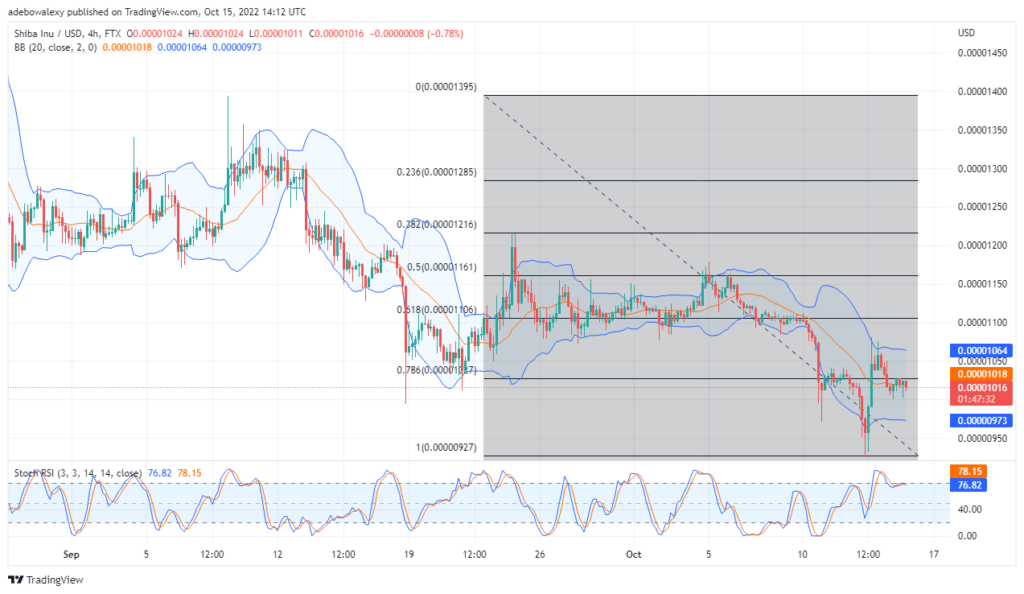
Shiba Inu Price Prediction Today, October 16, 2022: SHIB/USD Market Looks Dicey
SHIB/USD 4 hour shows that short-term traders may have found themselves in a dilemma. This is portrayed as price candles on the four-hour chart are now in contact with the MA line as it cuts across them. However, the appearance of the last red candle has pushed the price back under the MA line, by a tiny distance downwards.
Considering the Stochastic RSI, it could be seen that the lines of this stay in the overbought zone. But, the lines of this Indicator have performed a bearish crossover in the overbought. Nevertheless, at this point this line hasn’t taken a direction yet, therefore traders will have to wait for these lines to take direction. Also, a pending buy can be placed at any desired point above the MA line as price may break the price level of $0.00001027 to the upside shortly.

