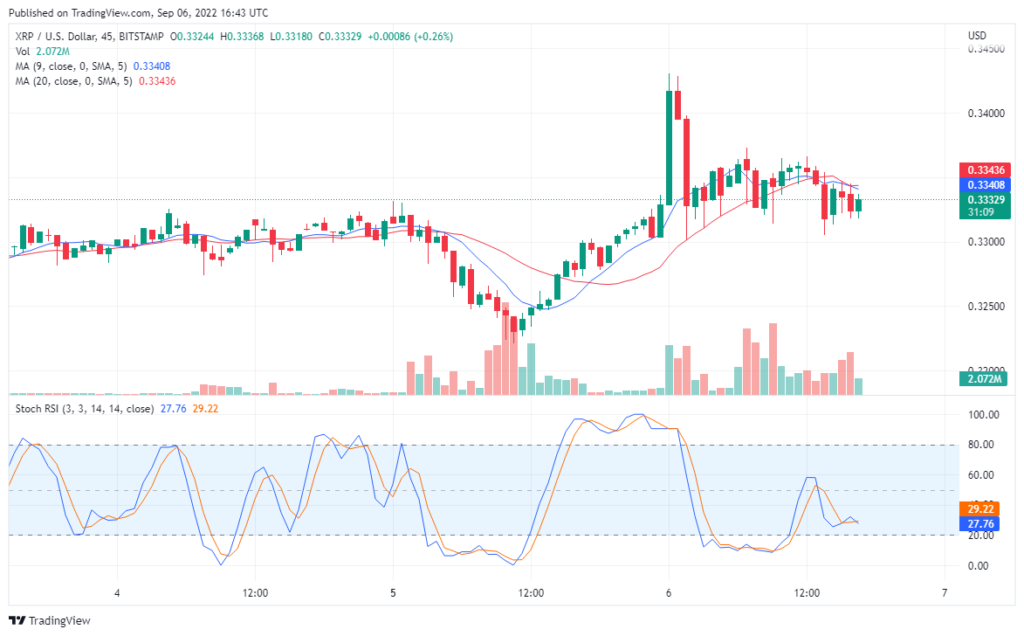
XRP has stayed down at lower support after it experienced a significant downside correction around the 17th of August. Currently, trading indicators are revealing that it is likely that this crypto break the current resistance of 0.33334 to the upside. Consequently, this will result in price action reaching higher levels.
Ripple Forecast Statistics Data:
Ripple current price: $0.333
Ripple market cap: $16.1 billion
Ripple circulating supply: 122.25 million
Ripple total supply: 49.65 billion
Ripple Coinmarketcap ranking: #7
In this analysis, we will consider the XRP/USD and XRP/BTC markets. This will be done to find where the price may arrive at next and how to profit from this market and other markets such as this.
Key Price Levels:
Ceiling levels: $0.3333, $0.3500, $0.3550
Floor levels: $0.3300, $0.3270, $0.3230
XRP Attempting to Favourably Position Itself, Massive Gains on TAMA
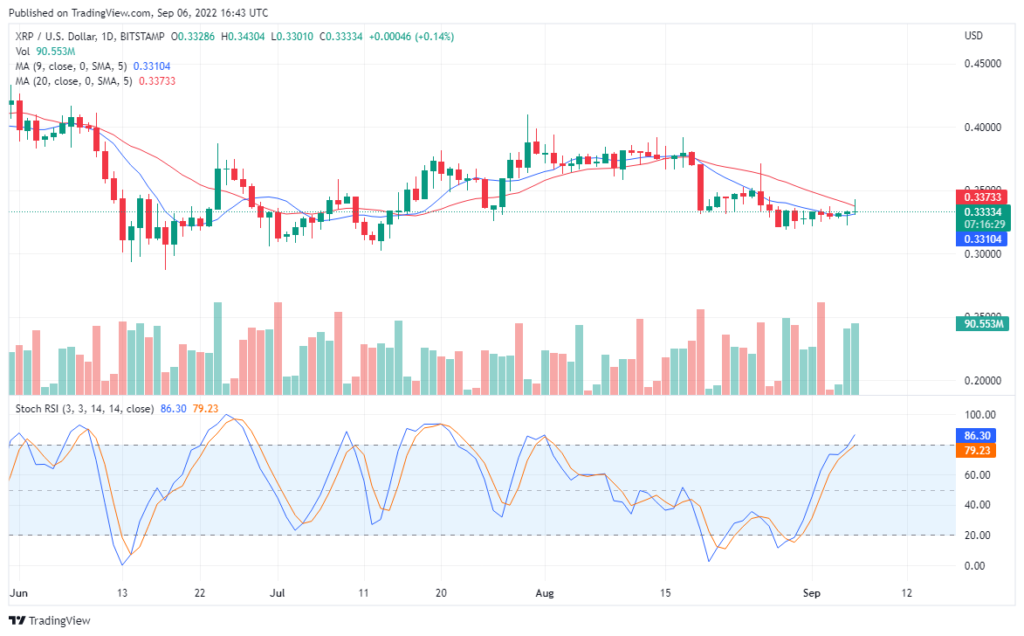
The XRP/USD daily price chart displays the effort of the buyer to push Ripple’s price action higher. At this point, the last candle has been able to recline on top of the 9 days MA. Also, the 20 days MA can be seen moving towards the 9 days MA as if to be attempting to cross each other. At this point, the last candle may finally form as inverted hammer candlesticks. Eventually, this will signal more bullishness to come. And, as buying pressure will continue, the price candles will eventually cross above the 9/20 day MA. Also, the RSI is still pointing upwards in the bought area. Consequently, this will further position price candles where it could gain more upside momentum. As a result, the price of XRP may reach $0.3700. Traders in this market can execute a buy order or place a pending buy of around $0.3420.
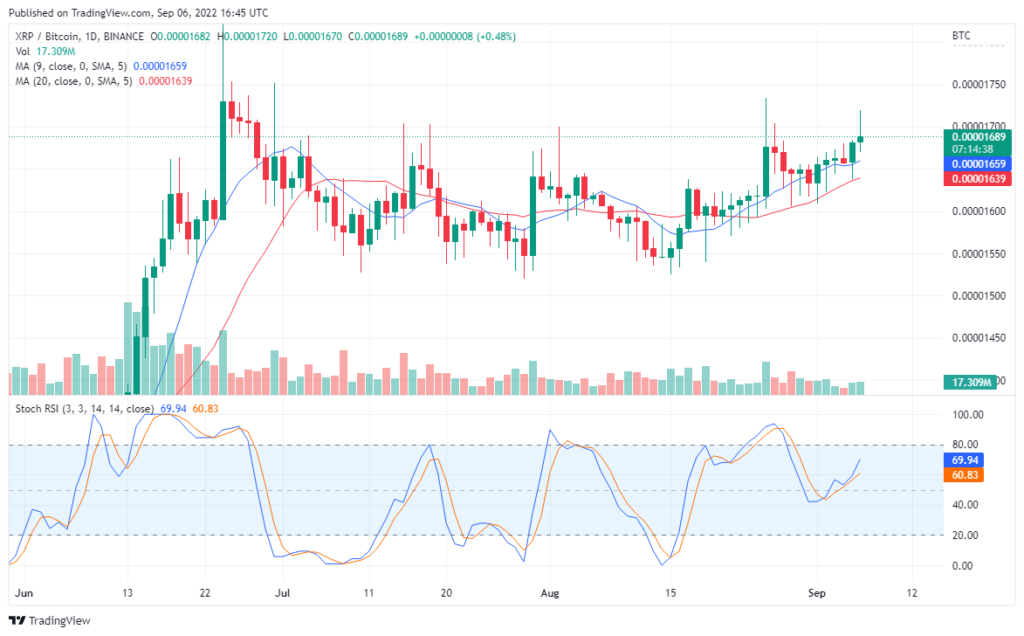
XRP Price Analysis: XRP/BTC Better Performance
XTP/BTC market has shown better performance, and the signs of even better performance are very much around in this market. On the pair’s daily price chart, price action has crossed above the 9 and 21-day MA. And with the position of the last candle, we can say that the bulls are on in this market.
In addition, the Stochastic RSI for this chart, after a minor correction has resumed its journey towards the overbought area. Going by the RSI display, we can anticipate that value may rise further upwards. Also, since the Stochastic RSI curves are just at approximately 61% and 70% level, the value of the pair in this market may raise to around 0.00001750 level. With the signs coming from trading indicators traders can either buy the pair straight up, or place an entry at 0.00001700. The same approach may be given to other market of like activities such as we have here.
Tamadoge presale shows plenty of appetite for quality crypto games project. Tamadoge’s fundraising success is testament to the fact that there is still plenty of appetite among crypto investors for quality products. The nascent project has now beaten the fundraising of STEPN, which raised $9.2 million from investors including FTX. Tamadoge is on track to surpass the success of the move to earn app.

