
Bitcoin is struggling below $24,500 against the US Dollar. BTC could continue to move down below the $23,650 and $23,500 support levels.
- Bitcoin is slowly moving lower and trading well below the $25,000 level.
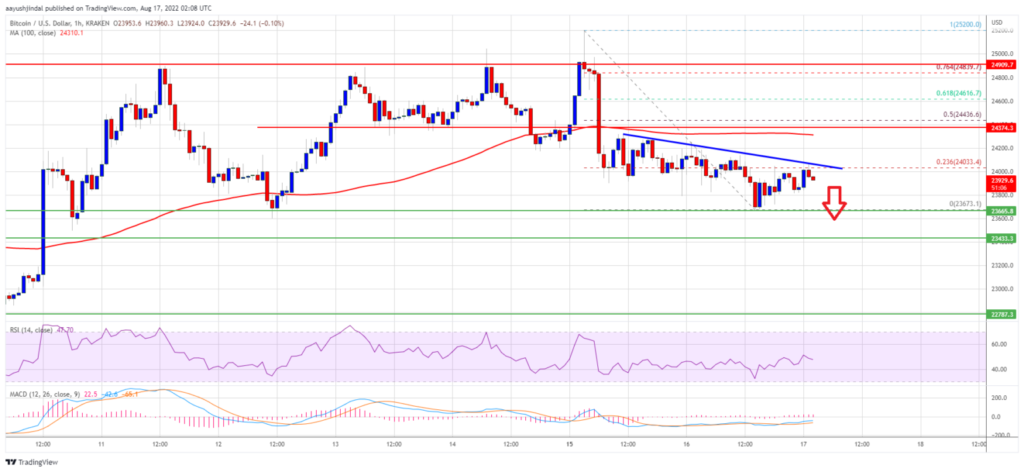
- The price is now trading below the $24,200 level and the 100 hourly simple moving average.
- There is a key bearish trend line forming with resistance near $24,020 on the hourly chart of the BTC/USD pair (data feed from Kraken).
- The pair could extend losses below the $23,650 and $23,500 support levels in the near term.
Bitcoin price started a slow and steady decline from the $25,000 resistance zone. BTC declined below the $24,650 and $24,500 levels to move into a short-term bearish zone.
There was a break below the $24,000 level and the 100 hourly simple moving average. The price traded as low as $23,673 and is currently consolidating losses. On the upside, an immediate resistance is near the $24,000 level. It is near the 23.6% Fib retracement level of the recent drop from the $25,200 swing high to $23,673 low.
There is also a key bearish trend line forming with resistance near $24,020 on the hourly chart of the BTC/USD pair. The first major resistance on the upside sits near the $24,250 level and the 100 hourly simple moving average.
The next key resistance is near the $24,450 zone. It is near the 50% Fib retracement level of the recent drop from the $25,200 swing high to $23,673 low. A close above the $24,450 and $24,500 resistance levels might start another increase.
In the stated case, the price may perhaps climb towards the $25,000 resistance. Any more gains might send the price towards the $25,800 level.
More Losses in BTC?
If bitcoin fails to clear the $24,450 resistance zone, it could continue to move down. An immediate support on the downside is near the $23,675 level.
The next major support now sits near the $23,450 level. A downside break and close below the $23,450 level might put a lot of pressure on the bulls. In the stated case, the price might decline towards the $22,750 level.
Technical indicators:
Hourly MACD – The MACD is now gaining pace in the bearish zone.
Hourly RSI (Relative Strength Index) – The RSI for BTC/USD is now below the 50 level.
Major Support Levels – $23,650, followed by $23,500.
Major Resistance Levels – $24,020, $24,450 and $24,500.