
Optimism has been one of the best-performing altcoins, over the past weeks.
Optimism Rollup network is one of the many blockchain solutions trying to solve Ethereum scalability solutions.
OP has shown a powerful bullish trend and continues to show why this is a crypto coin to accumulate for the bull run.
Daily Chart Analysis Of Optimism (OP)
Optimism (OP) started its bullish trend from the low of $0.45; after breaking out from the ranging channel with a resistance of $0.58, it has maintained an upward trend for the past weeks, going as high as $1.96, which is more than 300%.
Daily low – $0.45
Daily high – $1.96
Daily supports – $1.34, $0.93, $0.45

OP on the daily chart looks good with a strong uptrend over the past few days.
The structure of the bullish trends remains intact but accompanies it with a low volume showing that we could be coming to the end of the bullish trend.
The support on the 1D charts for OP has already been indicated to allow possible accumulation or Dollar Cost Averaging (DCA)
Dollar Cost averaging is a strategy employed to buy crypto assets with a sum of money in bits over time or a strategy used to buy crypto assets at market levels as the assets make reversals.
As of writing, OP is trading at $1.567 and could go to $1.34, which is the nearest support for accumulation.
This support corresponds with the Fibonacci retracement of 61.8%, a healthy pullback for all crypto assets that must maintain a strong bullish uptrend.
OP would have difficulty breaking its All Time High (ATH) of $2.2, but should this region be broken; OP will continually in an upward trend or a price discovery to form a resistance and major support.
Major support – $1.54, $0.93, $0.60, $0.45
Major resistance – $2.1
OP On The 4H Chart
On the 4H chart, OP shows a bearish divergence sign – meaning we could be coming to the end of the bullish trend that has lasted for several days.
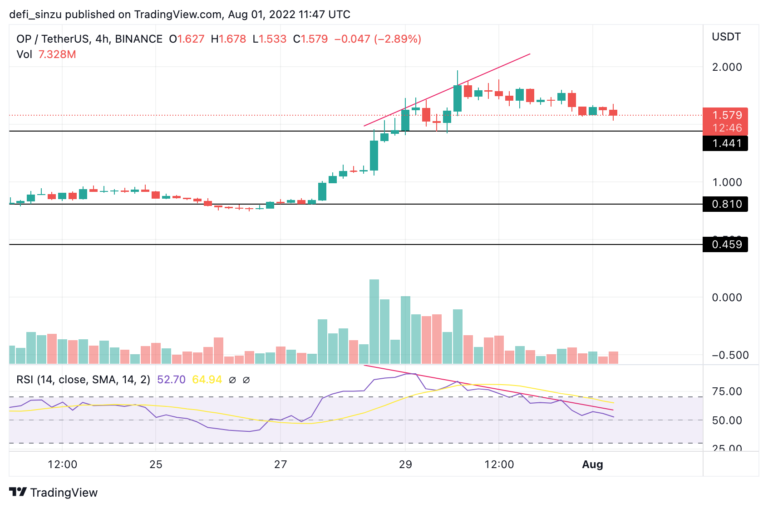
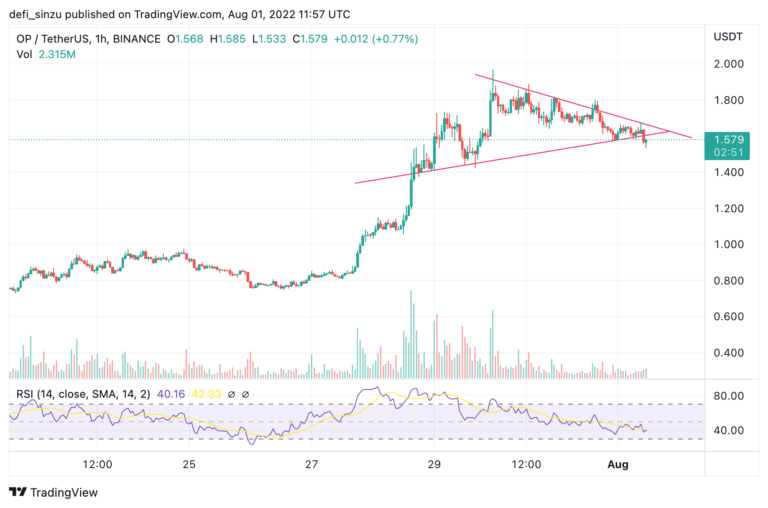
OP is currently trying to break below the ascending wedge on the 1H timeframe; a break and close below would mean going down to the next support.
OP holding above $1.1 means the bullish structure is still valid, but a break to the low of this range would invalidate the setup.
Major supports on 4H – $1.1, $0.9
Major resistance on 4H – $2.1
OP, in general, looks good both in the bear market and in the next bull run; this is one of the assets with a good use case and a very strong community behind it.