
BCH Resorts to Ranging –6月26日
BCH / USD市場の運用における一連の大幅な下落の勢いの後、暗号通貨の価格は現在、より低い取引エンドでのレンジングモーションに頼っています。 上向きと下向きの動きは、2.79の正のパーセンテージで119ドルから114ドルの間です。
BCH価格統計:
現在のBCH価格– $ 116.11
BCH時価総額–22億ドル
BCH循環供給–1,910万
BCHの総供給–1910万
Coinmarketcapランキング–#30
BCHリゾートからレンジング:BCHマーケット
キーレベル:
抵抗レベル:$ 140、$ 160、$ 180
サポートレベル:$ 100、$ 90、$ 80

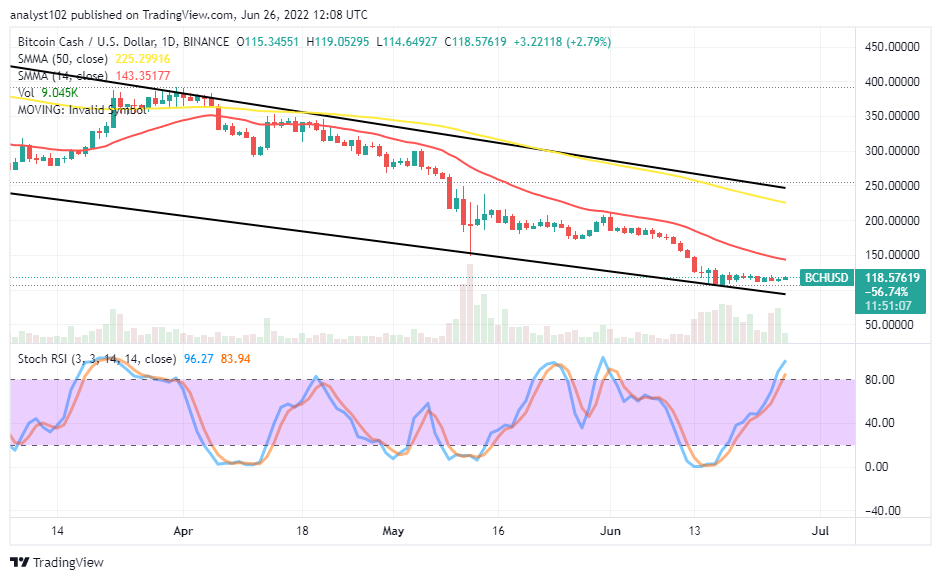
BCH / USD –日足チャート
日足チャートは、BCH市場が南に引かれた低い弱気トレンドラインの上で荒れ狂う動きに頼っていることを示しています。 14日間のSMA指標は、50日間のSMA指標の下にある現在の取引スポットのはるか南に向かっています。 上部の弱気トレンドラインは、より大きなSMAを密接に上回っています。 ストキャスティクスオシレーターは、買われ過ぎの地域に北上するように努力してきました。 そして、彼らはまだ北方向を指しており、上向きの力が進行中であることを示しています。
What the best resistance area will be ideal for the BCH/USD market bears to resurface?
As the BCH/USD market operation resorts to ranging motions currently, the best resistance area for bears to resurface will be around the $150 level to reshape the downward trend at its usual point of getting a sell signal to reorder. Launching a buying order at this moment may not be timely, running into a profit margin. But, in the womb of time, it will run. Long-position takers needed to be wary of overleveraging their positions to avoid the unnecessary whipsawed-trading condition in no time.
On the downside of the technical analysis, the BCH/USD market operation needed to run into resistances between $143 and $225 levels before getting a reliable sell signal while the price encounters variant rejections in the presumed trading zones. The upward forces toward achieving that seem to be forthcoming on a gradual moving mode. Short-position takers needed to be cautious of following the trend while the lower bearish trend line breached suddenly to the downside.
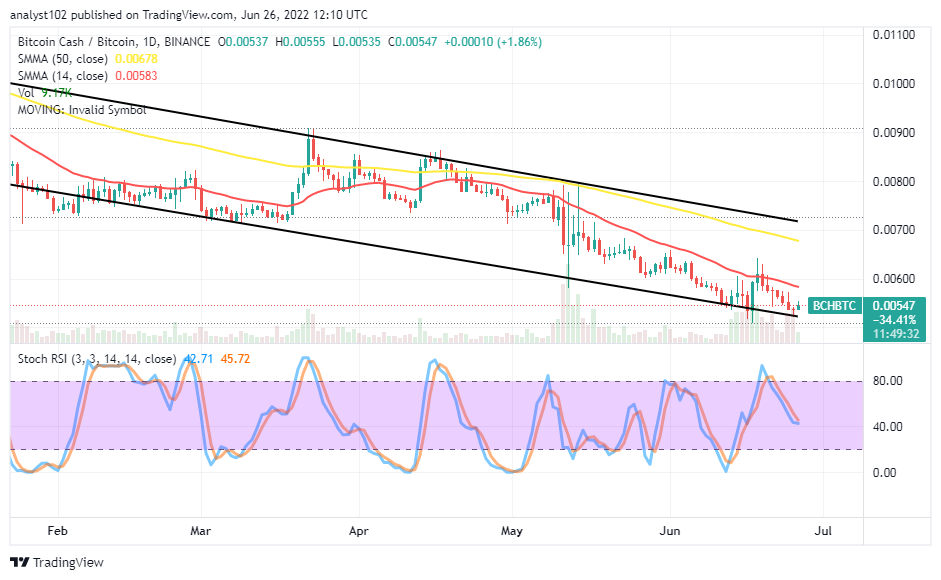
BCH/BTC Price Analysis
それに比べて、ビットコインキャッシュが登場し、ビットコインのトレンドの力に逆らう準備ができています。 暗号通貨ペアの価格は、弱気の低いトレンドラインと小さいSMAトレンドラインの間のハイモードの範囲に頼っています。 14日間のSMAインジケーターは、50日間のSMAインジケーターの下にあります。 ストキャスティクスオシレーターは、40の範囲の周りに南向きに配置されています。カウンタークリプトは、ベースクリプトに対するトレンドパワーが低下している可能性があります。 低い弱気トレンドラインの周りに強力なサポートベースラインを構築するために、価格は低いトレーディングゾーンにしばらく留まらなければならない場合があります。