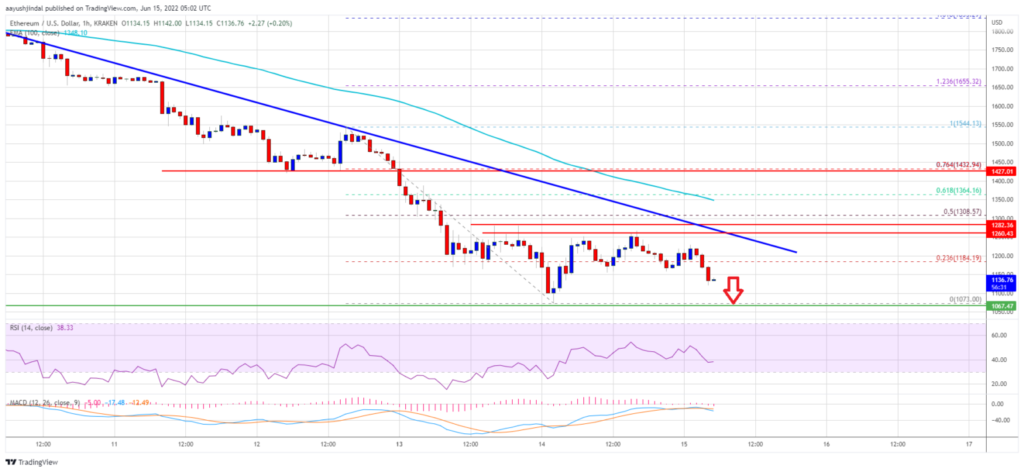
以太坊兑美元仍处于低于 1,200 美元的看跌区域。 除非突破 1,280 美元的阻力位,否则 ETH 可能会继续下跌。
- 以太坊仍处于 1,200 美元和 1,280 美元以下的下跌趋势中。
- 价格现在低于 1,250 美元和 100 小时简单移动平均线。
- There is a key bearish trend line forming with resistance near $1,245 on the hourly chart of ETH/USD (data feed via Kraken).
- The pair could resume its decline below the $1,120 and $1,100 levels in the near term.
Ethereum Price Faces Hurdles
Ethereum settled well below the $1,500 support zone. The price traded as low as $1,073 and recently started a minor upside correction.
There was a recovery wave above the $1,120 and $1,150 levels. Ether price climbed above the 23.6% Fib retracement level of the recent decline from the $1,545 swing high to $1,072 low. However, the price is still trading below $1,250 and the 100 hourly simple moving average.
The bears were active near the $1,260 resistance zone. There is also a key bearish trend line forming with resistance near $1,245 on the hourly chart of ETH/USD.
On the upside, an initial resistance is near the $1,240 level. The first major resistance is near the $1,280 and $1,300 levels. The 50% Fib retracement level of the recent decline from the $1,545 swing high to $1,072 low is also near the $1,300 zone.

A clear move above the trend line resistance and then $1,300 could start a recovery wave. The next major resistance is near the $1,350 level and the 100 hourly simple moving average. Any more gains could start a move towards the $1,440 resistance.
ETH 损失更多?
If ethereum fails to rise above the $1,280 resistance, it could continue to move down. An initial support on the downside is near the $1,120 zone.
下一个主要支撑位在 1,070 美元附近。 明确的走势并跌破 1,070 美元区域可能会给多头带来很大压力。 在上述情况下,价格可能会在短期内滑向 1,000 美元的支撑区域。
技术指标
每小时MACD - ETH/USD 的 MACD 现在在看跌区域获得动力。
每小时 RSI - ETH/USD 的 RSI 现在低于 50 水平。
主要支撑位 - 1,070 美元
主要阻力位 - 1,280 美元


