
Bitcoin spiked above the $20,500 resistance against the US Dollar. BTC is now struggling near $19,800, with a major support near the $19,600 zone.
- Bitcoin made another attempt to gain strength above $20,500 but failed.
- The price is now trading above the $19,500 level and the 100 hourly simple moving average.
- There is a key bullish trend line forming with support near $19,550 on the hourly chart of the BTC/USD pair (data feed from Kraken).
- The pair could rise again unless there is a clear move below the $19,500 support zone.
Bitcoin Price Faces Hurdles
Bitcoin price remained supported above the $19,500 zone. BTC started another increase and climbed above the $20,000 resistance zone.
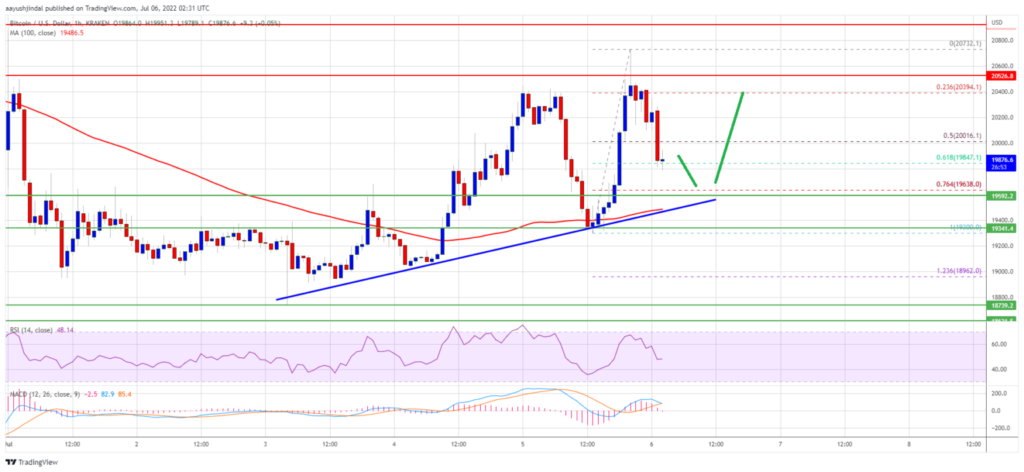
There was a spike above the $20,500 resistance zone but the bulls failed to gain strength. A high was formed near $20,732 and the price corrected gains. There was a drop below the $20,200 and $20,000 support levels.
Bitcoin traded below the 50% Fib retracement level of the upward move from the $19,300 swing low to $20,732 swing high. It is now trading above the $19,500 level and the 100 hourly simple moving average. There is also a key bullish trend line forming with support near $19,550 on the hourly chart of the BTC/USD pair.
No lado positivo, o preço está enfrentando resistência perto dos níveis de US$ 20.000 e US$ 20.200. A próxima resistência chave está perto da zona de US$ 20.500. Um fechamento acima da zona de resistência de US$ 20.500 pode abrir as portas para um aumento decente.
No caso declarado, o preço pode subir para o nível de US$ 21.200. A próxima grande resistência fica perto do nível de US$ 21.500.
Mais perdas no BTC?
Se o bitcoin não conseguir limpar a zona de resistência de US$ 20.500, ele poderá continuar caindo. Um suporte imediato no lado negativo está próximo de US$ 19.650. Está perto do nível de retração de Fibonacci de 76,4% do movimento ascendente do balanço baixo de US$ 19.300 para o balanço alto de US$ 20.732.
O próximo grande suporte agora fica perto do nível de US$ 19.500 ou da zona da linha de tendência. Um fechamento abaixo da zona de suporte de US$ 19.500 pode aumentar a pressão de venda. No caso declarado, o preço pode cair para o nível de US$ 18.740.
Indicadores técnicos:
MACD horário – O MACD agora está perdendo ritmo na zona de alta.
RSI por hora (Índice de Força Relativa) – O RSI para BTC/USD está agora perto do nível 50.
Principais níveis de suporte – $ 19.650, seguidos por $ 19.500.
Principais níveis de resistência – $ 20.200, $ 20.500 e $ 21.200.