La predicción del precio de Bitcoin muestra que BTC enfrenta un impulso bajista ya que la estafa no logra cruzar por encima del canal.
Datos estadísticos de predicción de Bitcoin:
- Precio de Bitcoin ahora – $22,226
- Capitalización de mercado de Bitcoin: $ 424.8 mil millones
- Suministro circulante de Bitcoin: 19,1 millones
- Suministro total de Bitcoin: 19,1 millones
- Clasificación de Bitcoin Coinmarketcap – #1
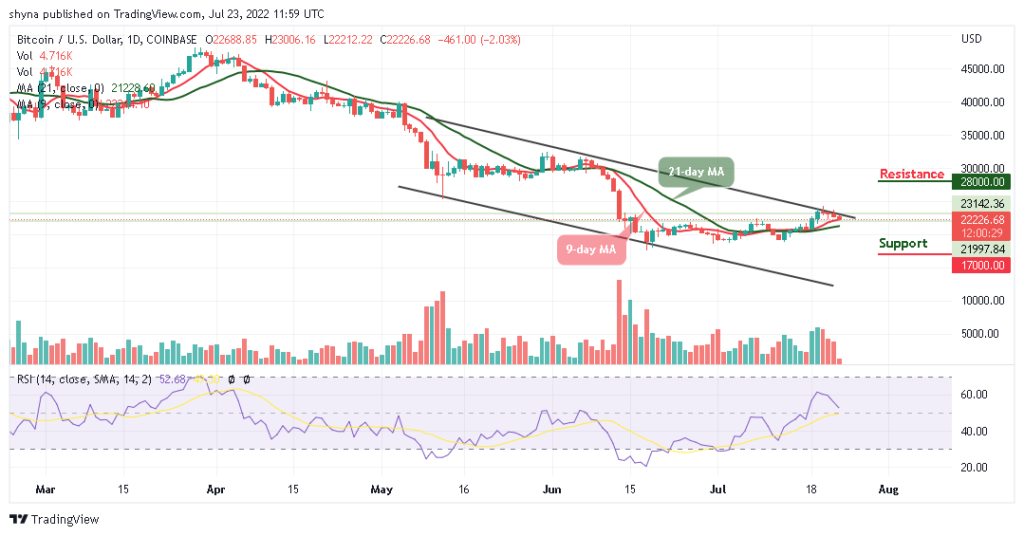
Tendencia a largo plazo de BTC/USD: bajista (gráfico diario)
Niveles clave:
Niveles de resistencia: $28 000, $30 000, $32 000
Niveles de soporte: $17,000, $15,000, $13,000
BTC/USD ronda los $22,226. Ha habido casos en que BTC toca el mínimo de $ 22,212 para sostener la acción del precio bajista. Al momento de escribir, el camino de menor resistencia está alrededor de los promedios móviles de 9 y 21 días, y el gráfico diario muestra que la formación de una tendencia bajista puede enfocarse.
Predicción del precio de Bitcoin: BTC no logra tocar la resistencia crucial
Mirando el gráfico diario, los alcistas están luchando por mantener el precio de Bitcoin por encima de los promedios móviles de 9 y 21 días, pero el precio actualmente está cayendo por debajo de la media móvil de 9 días. BTC/USD ha estado sufriendo desde la sesión europea, ya que el índice de fuerza relativa del indicador técnico (14) se mueve para cruzar por debajo del nivel 50. Esto podría significar que la moneda King aún no está lista para el alza.
Por el lado positivo, la recuperación puede no ser fácil ya que la moneda tendría que cruzar por encima del límite superior del canal. Mientras tanto, un movimiento sostenible por encima de esta barrera puede ubicar el nivel de resistencia de $25 000, lo que puede permitir una recuperación prolongada hacia los posibles niveles de resistencia de $28 000, $30 000 y $32 000. Sin embargo, un aumento en la presión de venta en todo el mercado podría llevar el precio de Bitcoin hacia los soportes de $17 000, $15 000 y $13 000.
Tendencia a mediano plazo de BTC/USD: bajista (gráfico de 4 horas)
El precio de Bitcoin cotiza por debajo de los promedios móviles de 9 y 21 días en el gráfico de 4 horas. Si el precio supera los promedios móviles, podría moverse hacia el límite superior del canal. Mientras tanto, como el índice de fuerza relativa del indicador técnico (14) permanece por debajo del nivel 50, la moneda rey puede alcanzar el nivel de resistencia de $ 24,000 y más, si los alcistas aumentan la presión.
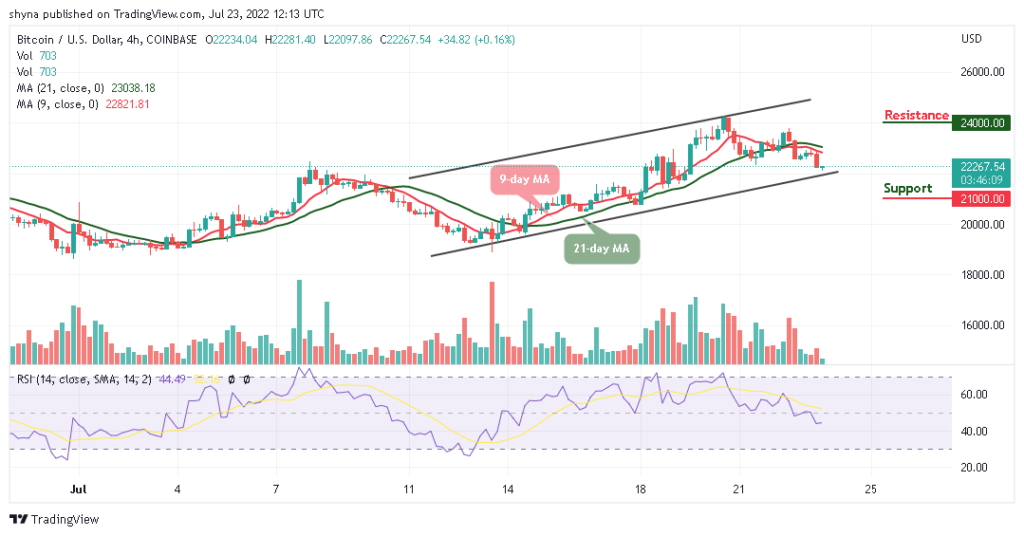
Por otro lado, si el movimiento bajista continúa, es posible que el nivel de soporte de $22 000 no pueda mantener la presión de venta, y es probable que BTC/USD caiga al nivel de soporte de $21 000 o menos si el precio cruza por debajo del límite inferior. del canal